Three-statement forecast
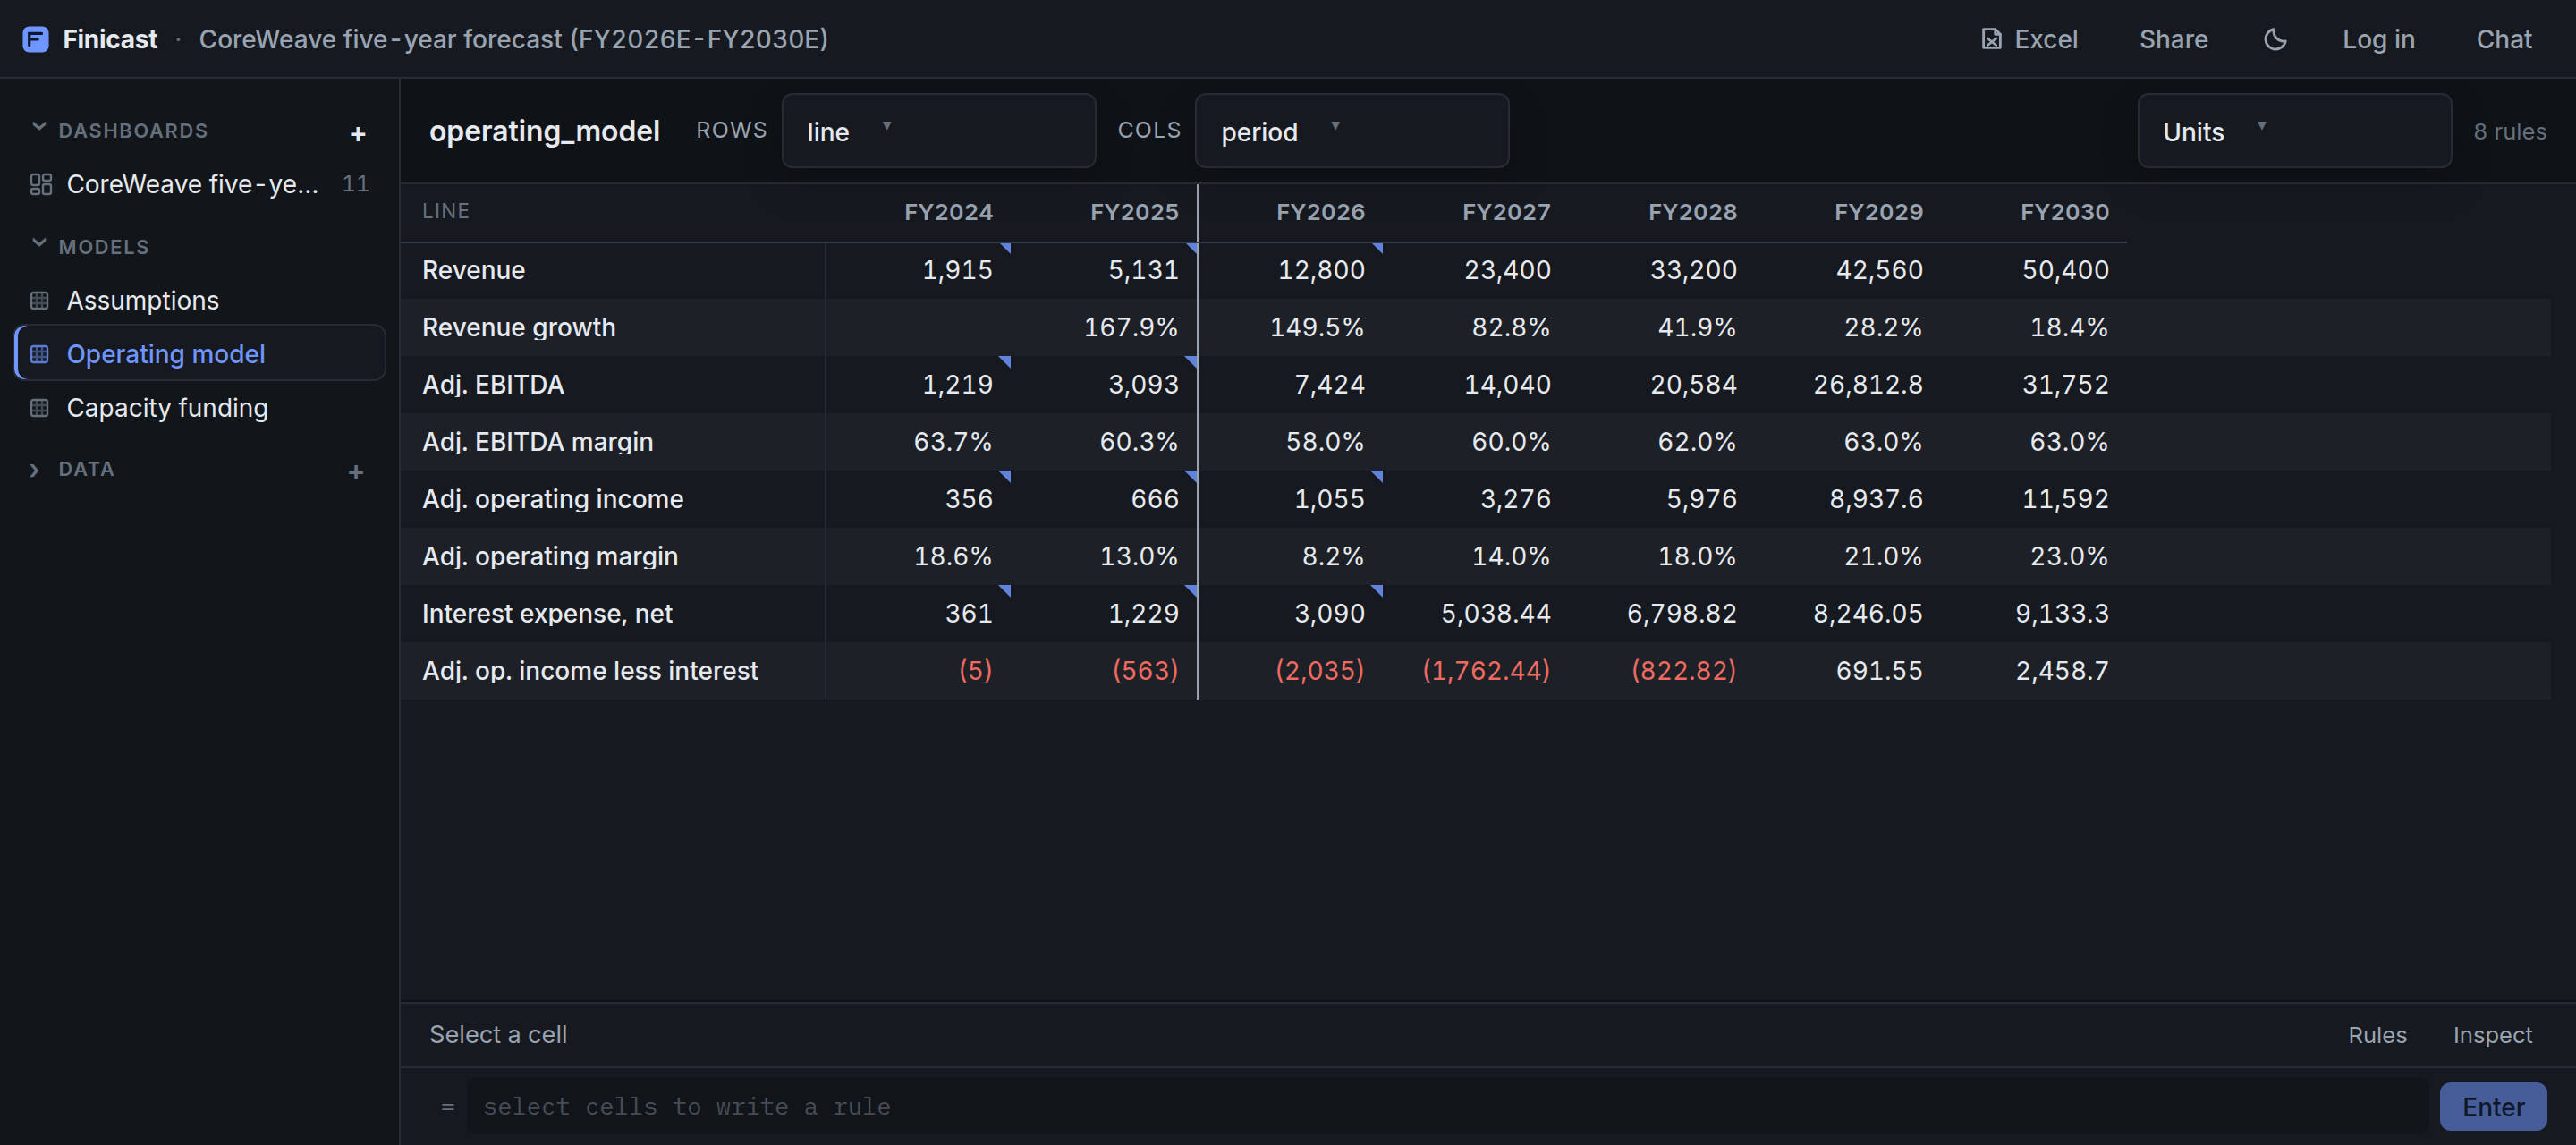
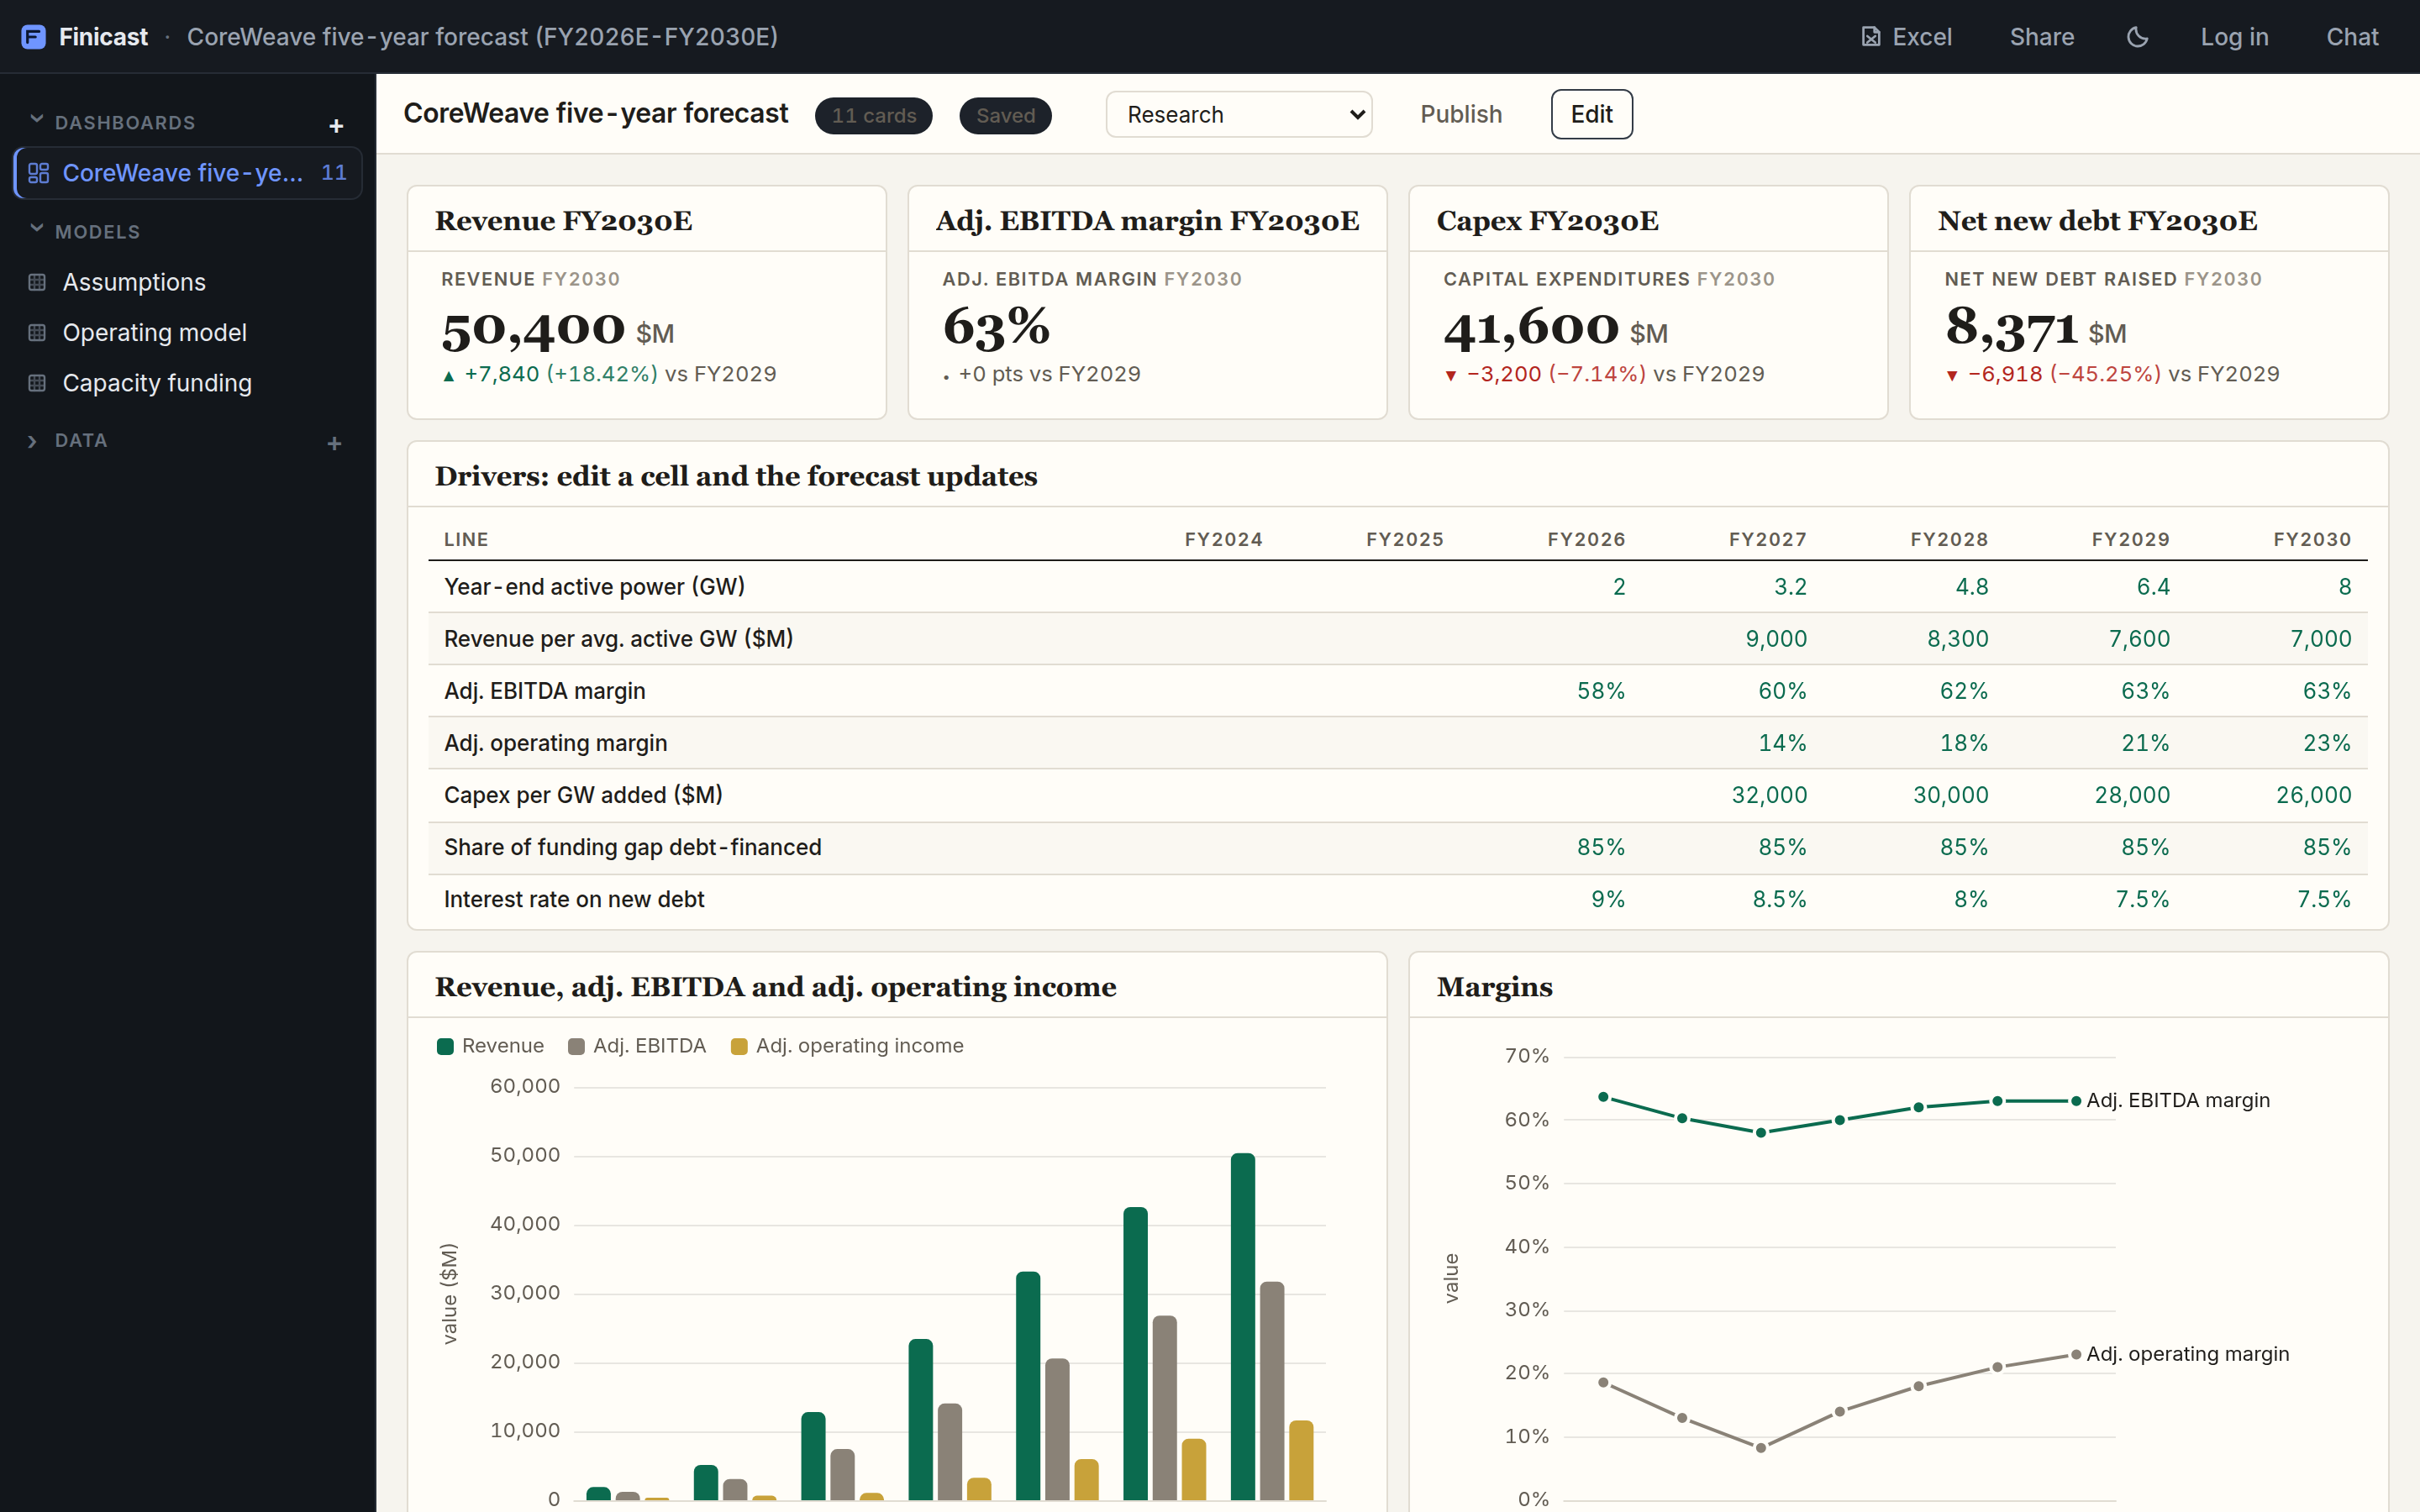
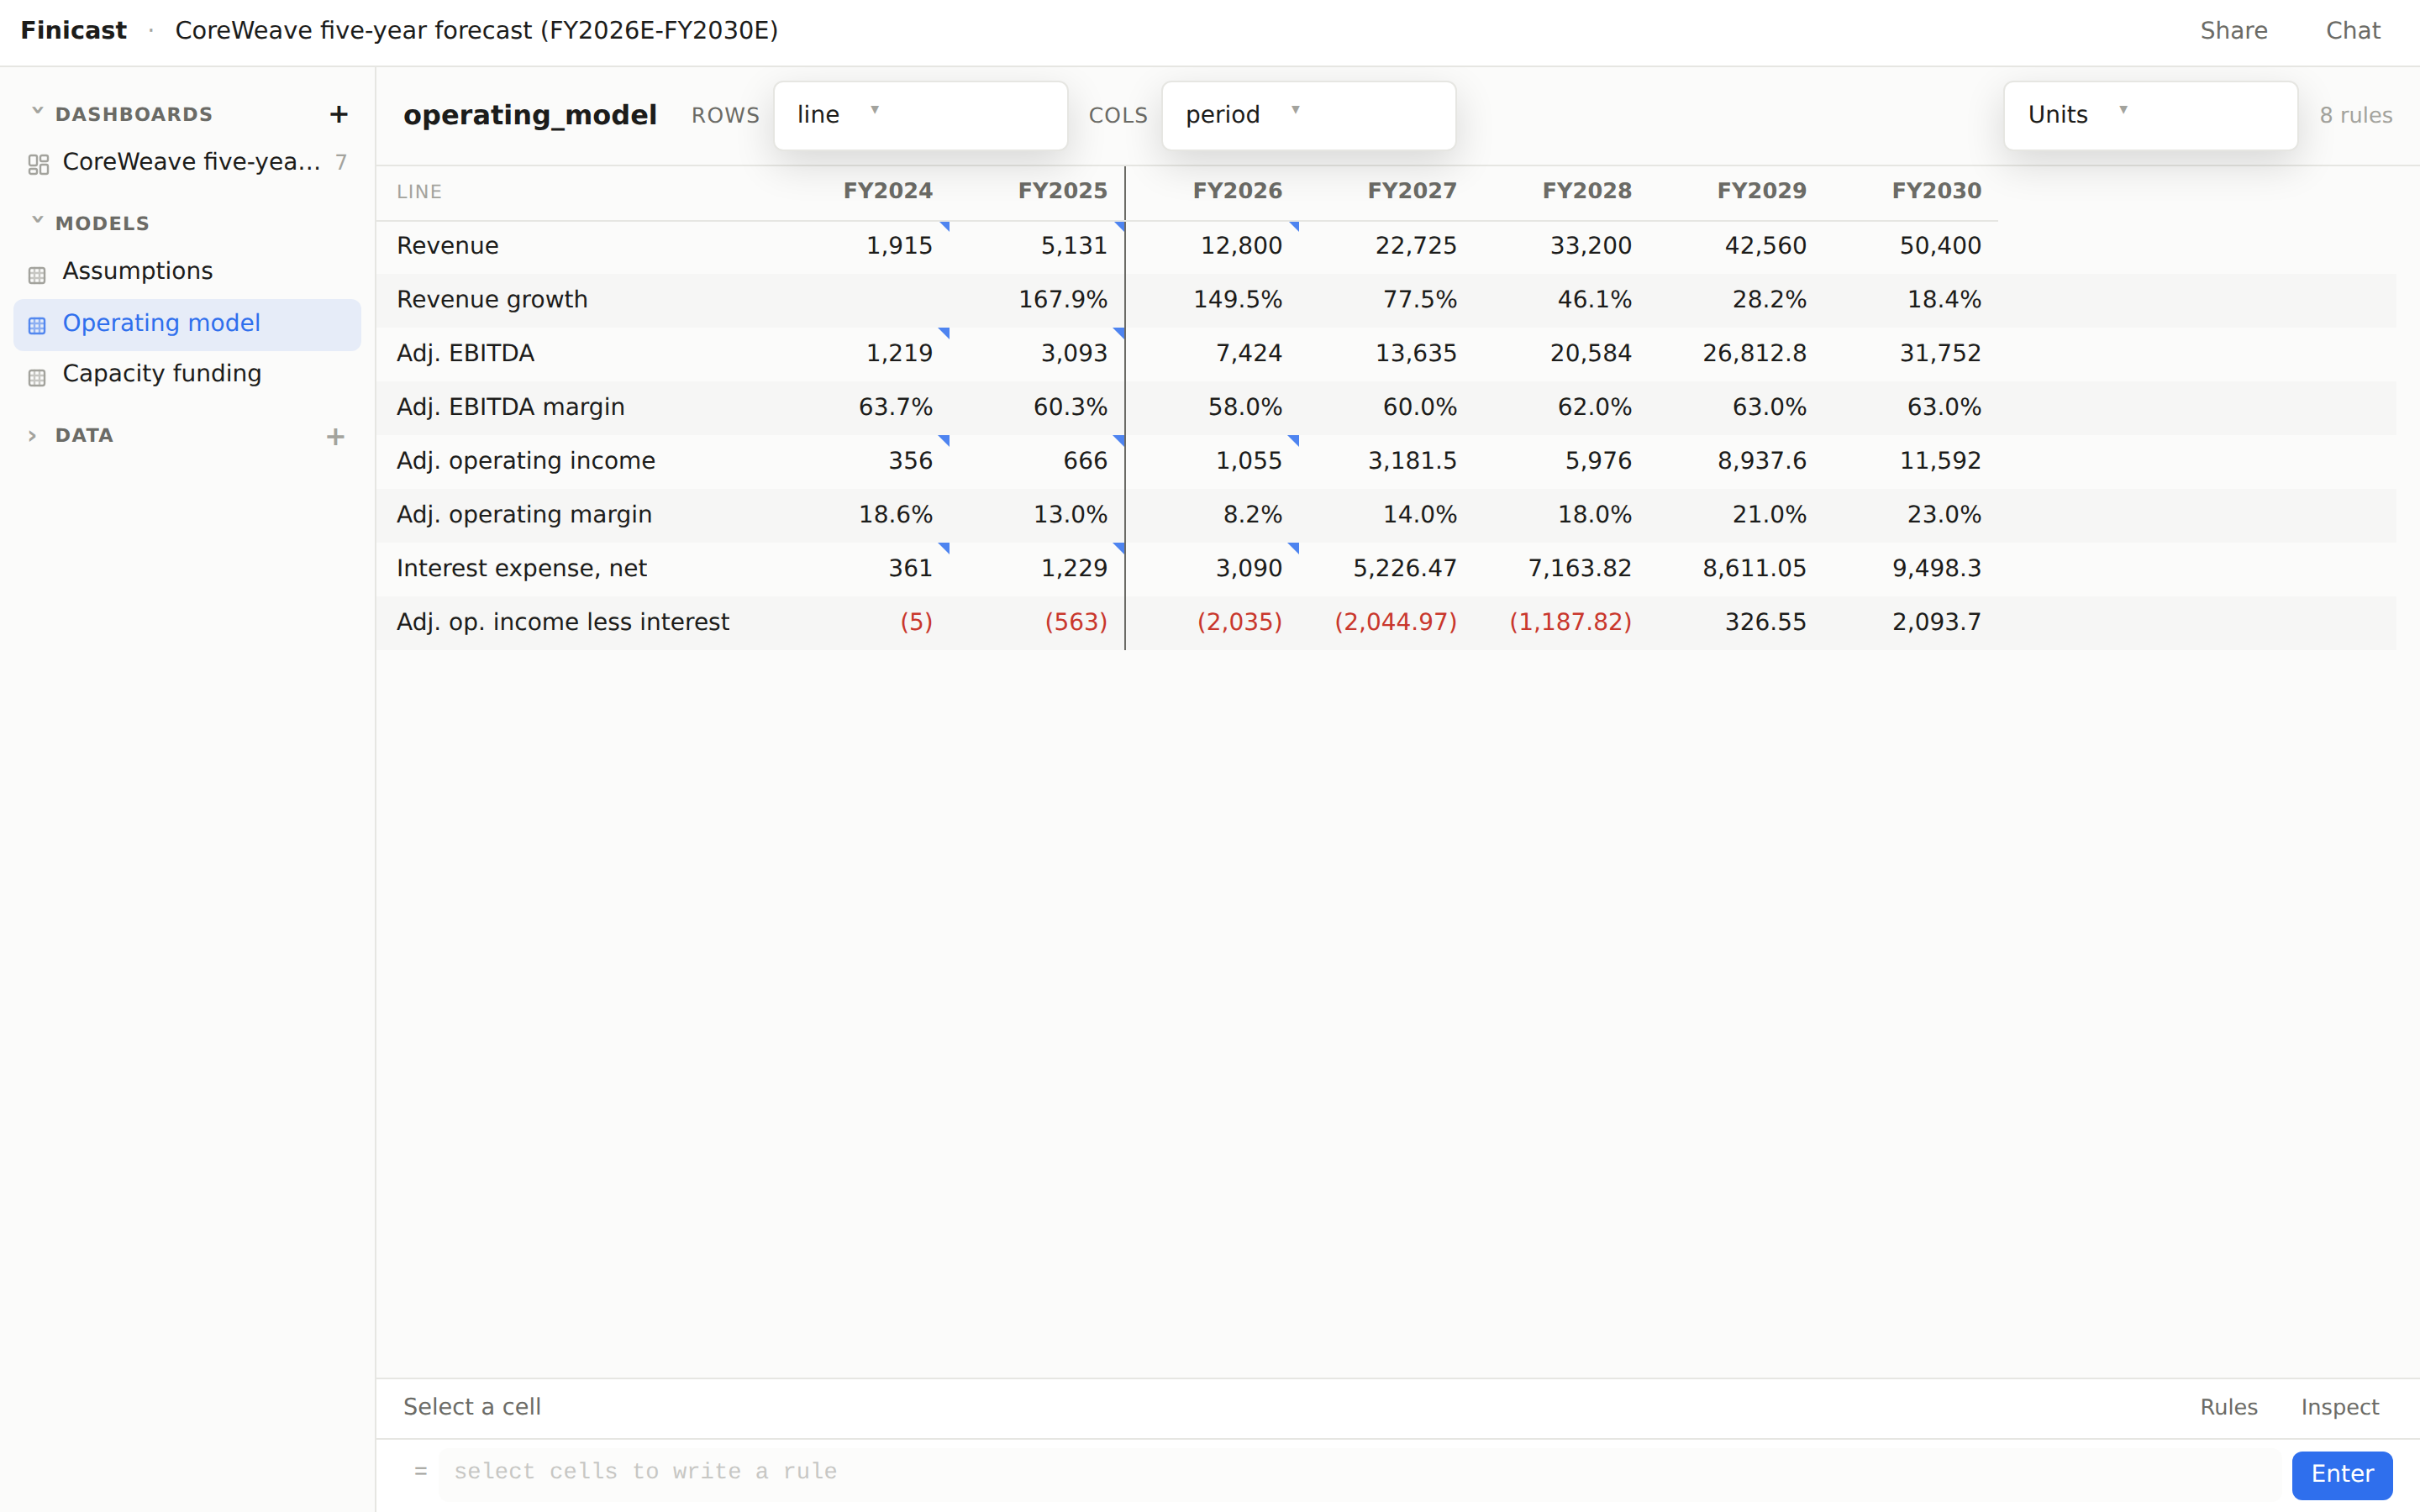
Income statement, cash flow and balance sheet for CoreWeave, driven by an editable assumptions table. Built by Claude from one prompt.
The database AI agents use for financial models
One prompt in Claude or ChatGPT. A live model your team can steer.
Works in Claude, ChatGPT, Claude Code, Codex and Cursor. No account, no connector.
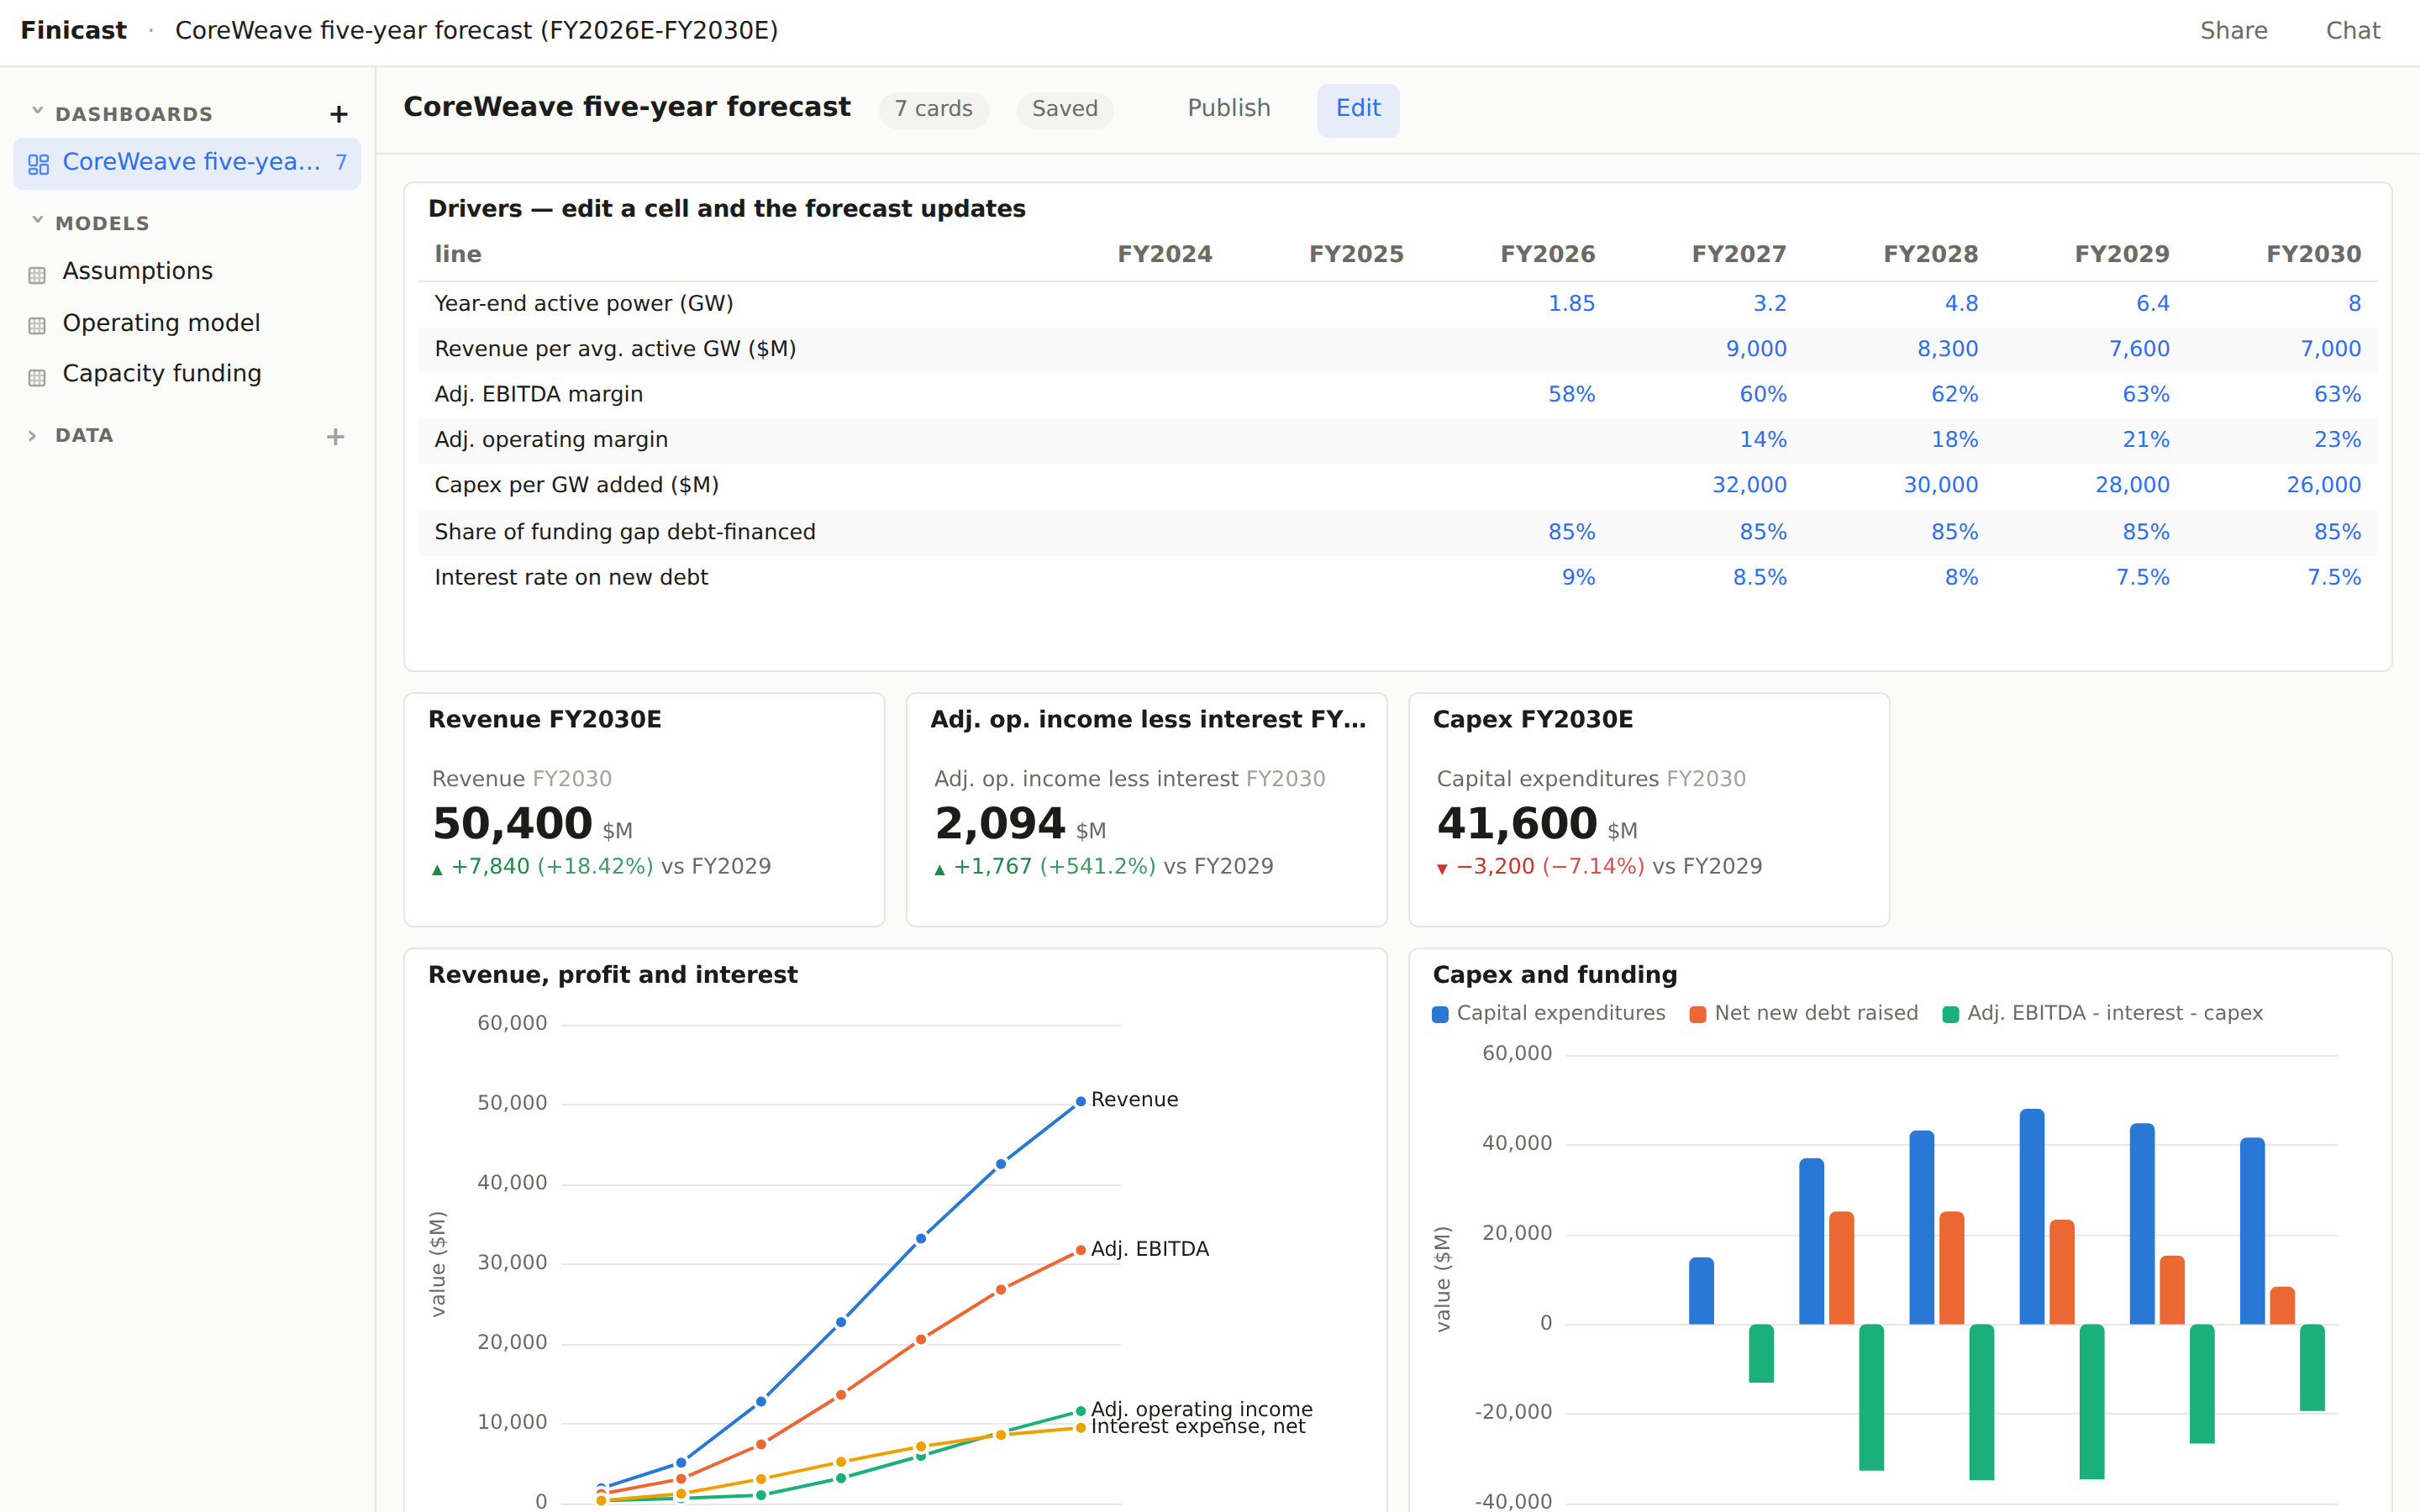
Built by Claude from that prompt. Change a driver and every statement follows. Open the live model
Each is a live workspace built from a tested document: change a driver, watch every statement follow, download the workbook. The document behind each one is linked, so an agent can start from it.
Income statement, cash flow and balance sheet for CoreWeave, driven by an editable assumptions table. Built by Claude from one prompt.
Unlevered free cash flow with mid-year discounting, a WACC build-up, perpetuity and exit-multiple terminal values, the equity bridge, and sensitivity tables of price per share.
Apple against seven peers: EV/Revenue, EV/EBITDA, P/E, growth and margins on LTM and NTM, peer statistics, and the implied price. Edit any input.
Twelve software deals with terms and premiums, statistics over the set and its subsets, and the implied value of the target at each.
A $55M ARR SaaS sales org: 2,000 opportunities, funnel, BDR scorecards, quotas, accelerators, kickers and SPIFFs, with dashboards for the CRO, VP Sales, sales ops, reps, SDRs and marketing.
A ledger rolled into subsidiary × department × line × month, budget and variance as versions, manager commentary alongside.
A general ledger CSV becomes a monthly operating plan: actuals through August, a driver-based forecast, budget beside outlook, YTD and full-year by entity and department. Click any account to drill into its ledger entries.
Bear, base and bull as a dimension: one rule set, drivers per case, results side by side.
Four people share one book: every trade and every watchlist note carries the person who entered it and the person who changed it last, filled by the engine, and those columns pivot like any other dimension.
Intel's share price since 2013 with every CEO appointment marked on the chart, a tenure scorecard of the return under each, and a click on any month for the daily closes behind it.
Each one is live: the charts below are the model itself, not a picture of it. Open one and every dashboard, drill-down and filter works, with nothing to change.
2 dashboards · Sep 25, 2026 · CEO changes, 12-24 months on · CEO drill-down
1 dashboard · Sep 22, 2026 · Meta comparable companies
2 dashboards · Sep 29, 2026 · Where the grid is growing · One state
1 dashboard · Sep 22, 2026 · CoreWeave forecast
4 dashboards · Sep 24, 2026 · AI cycle vs prior cycles · Scale · Speed · …
3 dashboards · Sep 24, 2026 · Largest economies by debt · Central bank balance sheets · Government balance sheets
7 dashboards · Sep 27, 2026 · Controller overview · Cash flow & forecast · WIP schedule · …
2 dashboards · Sep 25, 2026 · CEO changes, 24-36 months on · CEO drill-down
3 dashboards · Sep 30, 2026 · Hockey-stick scan · Stock · Derived-demand bottlenecks
All public models → Press Publish in any workspace to list yours.
npm install -g finidbrevenue[frame=fcst] = PREV(revenue) * (1 + growth)
gross_profit = revenue - cogs
cash[frame=fcst] = PREV(cash) + cash_flow.free_cash_flowIncome statement, cash flow, balance sheet. One document in, statements and a link out.
Change a driver. Every dependent cell updates in milliseconds, for everyone with the link.
This is a live card from a Finicast dashboard, not a screenshot: Intel's month-end close since 2013, with every chief executive appointment marked and the interim periods shaded. The agent wrote the annotations into the model document. Click any month and it drills into that month's daily closes.
Open the model → Document Prices frozen in the document with their as-of date.
A rule names a line item and the region it covers. One rule, every forecast period.
An edit recomputes only what depends on it. Verified against a reference evaluator.
Drivers in a table, KPIs and charts that follow. The agent declares them in the same document.
MCP, REST, a JSON model document, an npm CLI, a skill file. Every error carries a fix.
| Spreadsheet | Script | Finicast | |
|---|---|---|---|
| A 40-line, 12-period statement | 480 cell formulas | A few hundred lines | ≈ 12 rules |
| Forecast vs. actual periods | Hand-picked ranges | Index arithmetic | frame = fcst |
| One input changes | Whole workbook | Re-run the script | Only what depends on it |
| What the person gets | A file | A number | A live model to steer |
{
  "periods":  { "start": "2022-01", "count": 9, "grain": "year", "histUntil": "2025-12-31" },
  "pivots": {
    "assumptions":      { "lines": ["revenue_growth", "gross_margin"], "inputs": { "revenue_growth": { "fy2026": 0.6 } } },
    "income_statement": { "lines": ["revenue", "cogs", "gross_profit"],
                          "inputs": { "revenue": { "fy2025": 5131 } },
                          "rules":  "revenue[frame=fcst] = PREV(revenue) * (1 + assumptions.revenue_growth)" }
  },
  "outputs": "all",
  "dashboards": "auto"
}
curl -X POST https://finicast.com/api/build --data @model.json
# → statements as markdown + a link to the live workspacefinicast.com/api/mcpnpx -y finidb mcp · build offline with finidb buildFree
Self-hosted from npm, for noncommercial use.
npm install -g finidbFree during preview
Hosted workspaces, dashboards and MCP at finicast.com.
Start with the promptPer organization
A license for the engine in a business or a product.
Talk to us